
I often get questions regarding debugging of SSIS packages with the most common scenario being a need to “see” the data flowing down the data pipeline. SQL Server Integration Services (SSIS) packages are explored and edited visually within the SQL Server Data Tools (SSDT) and hence, the mechanism to troubleshoot an SSIS package when developing it also has to be visual.
The Data Viewer allows a developer to pause the data flow in a data flow task and look at the data as it is on that point in the pipeline. Today, I will introduce you to the Data Viewer.
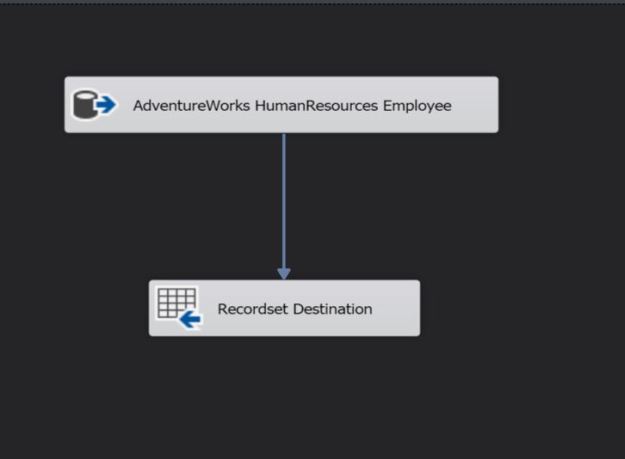
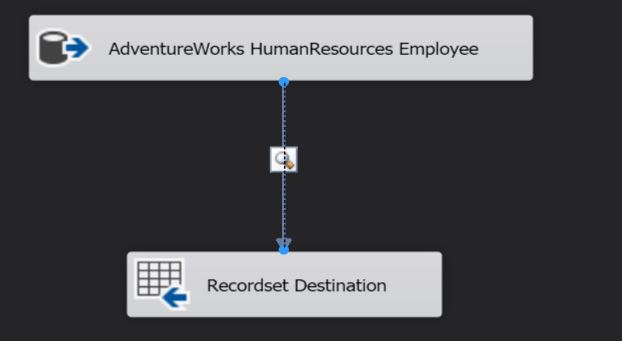
Sample SSIS package to demonstrate Data Viewer on the Data Flow Pipeline
The data flow is quite simply taking all the records from the [HumanResources].[Employee] table of the sample [AdventureWorks2014] database and putting into an object variable via the Recordset destination (I am using the Recordset destination for the demo here for the sake of simplicity).
Using the Data Viewer
If I want to study the data flowing through the data pipeline, all I need to do is right-click on the data flow path and choose “Enable Data Viewer” (a data flow path being the connection between a source and a transformation, between two transformations or a transformation and a destination).
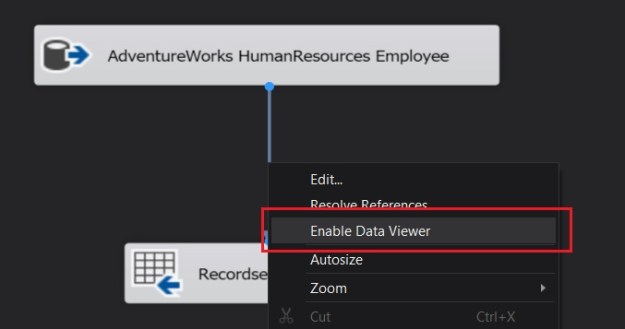
Enabling the Data Viewer on a Data Flow Pipeline

Magnifying glass indicates Data Viewer is enabled
As can be seen from the screen grab above, a magnifying glass icon on the data flow now appears indicating that the data flow is configured for viewing.
If I execute the SSIS package at this point, I see that the data flow pauses just before it starts writing to the destination and opens a new grid window. The window resembles a normal dataset viewer (if you are familiar with developing C# or ASP.NET applications in Visual Studio, you would feel right at home!) which contains the data flowing through the data pipeline. You can even copy this grid to Excel or any other file for further research (Tip!).
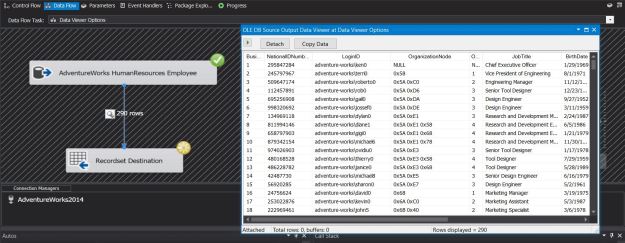
Data Viewer showing data flowing through the data path
Once you have studied the data flowing through, you can choose to either stop the transaction (by stopping execution of the package) or allowing the package to execute through by clicking on the “green” arrow on the data viewer.

Allowing the data flow to continue down the pipeline by allowing the package to resume execution
Filtering columns displayed on the Data Viewer
Sometimes, we may not want to sift through all the columns in the data pipeline. If we know that a particular column is causing some problems, we may just want to monitor that column. One can explicitly choose which columns should be displayed on the data viewer by going into the data flow properties.
- Right-click on the data flow path and choose “Edit”
- Go to “Data Viewer”
- Use the arrow buttons to selectively choose which columns to display in the data viewer
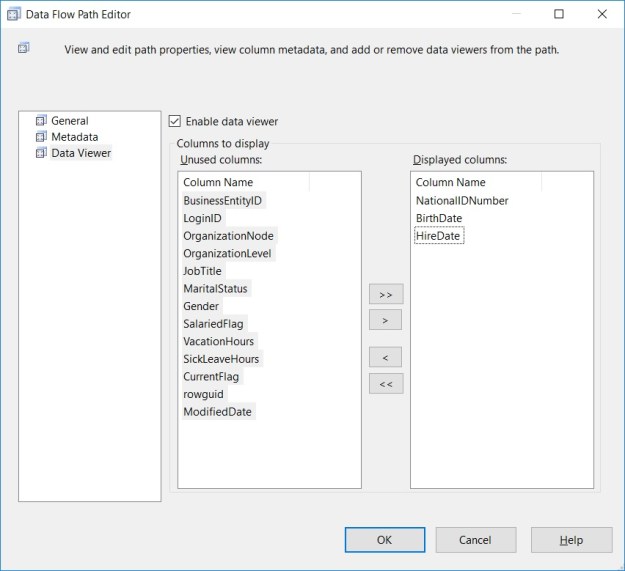
Selectively choosing columns visible on the Data Viewer
Summary
The Data Viewer can be used for design time troubleshooting of an SSIS package, allowing developers to pause the data flow and monitor the data flowing down the data pipeline.
- You can have multiple data viewers in your data flow task so that you can monitor each part of the data flow
- You can control the columns seen in the data viewer so that you can focus on the fields of interest
- You can copy this data for further research/maintaining a record
- If you have transformation components that use 64-bit components, you may need to turn off the “Run64BitRuntime” under the Debug options (Debug -> Solution Properties -> Configuration Properties -> Debugging)
Further Reading
Until we meet next time,
Be courteous. Drive responsibly.


Thanks for poosting this
LikeLike