SQL Server – T-SQL – Best Practice – Composite Primary Keys – Performance (and accuracy) impact


One of the reasons I enjoy working with Microsoft SQL Server because often I find that its behaviour is a classic case of GIGO (Garbage In Garbage Out). Jacob Sebastian (LinkedIn) always makes it a point to mention in his TechEd and Community Tech Days sessions that one must also treat SQL Server with respect, else it will create problems for us!

Based on my practical experience in resolving issues during code review and sometimes during bug-fixing, what I am going to discuss about today demonstrates that if we (i.e. SQL developers) do not respect SQL Server or feed it the wrong queries, the output will be wrong!

Composite Primary Keys

There are many cases when we have the primary key on a table as a composite key, i.e. comprised of one or more key columns. Let us assume that we are making an application for a courier company, and have divided the country into multiple zones. Each zone has a set of delivery centers supported by the company.

USE tempdb
GO

IF (OBJECT_ID('tempdb.dbo.IndexBehaviourTest') IS NOT NULL)
	DROP TABLE tempdb.dbo.IndexBehaviourTest

CREATE TABLE IndexBehaviourTest (CityId INT NOT NULL,
                                 ZoneId INT NOT NULL,
                                 City VARCHAR(20),
                                 PRIMARY KEY(CityId, ZoneId))
GO

INSERT INTO IndexBehaviourTest (CityId, ZoneId, City)
VALUES
(1, 1, 'Delhi'),
(2, 1, 'Chandigadh'),
(1, 2, 'Mumbai'),
(2, 2, 'Ahmedabad'),
(1, 3, 'Kolkotta'),
(2, 3, 'Guwhati'),
(1, 4, 'Bengaluru'),
(2, 4, 'Chennai')
GO

As you can see from the script above, both the ZoneId and the CityId together identify a unique delivery location. Such cases are ideal for use of a composite primary key.

All of us “know” that whenever we write a query, we need to use the full primary key as the qualifier/filter in the WHERE clause. However, those who have supported a product for long will know that often developers in a rush to get things out of the door throw caution to the wind and proceed with whatever works.

The errors that occur

An unexpected result set

Normally, when developers develop code and unit test, the focus is more on getting the code to work, not on the accuracy of the code. The developer would begin by inserting a few cities into the database, and then use a simple query to fetch the results.

USE tempdb
GO
--Insert some unit test data
INSERT INTO IndexBehaviourTest (CityId, ZoneId, City)
VALUES
(3, 1, 'Noida')

--Fetch the test data to unit test
SELECT * FROM IndexBehaviourTest WHERE CityId = 3;
GO

The developer would be happy that the code worked and that SQL Server performed an index seek as expected. The developer would therefore integrate the query into source control. However, an incomplete primary key has been used and outside of the unit test data, the user is bound to end up with an unexpected result set.

USE tempdb
GO
--Impact of using only part of the key
SELECT * FROM IndexBehaviourTest WHERE CityId = 2;
GO

As you can see, SQL Server returned us an incorrect result set because we requested “garbage” by not specifying the full primary key.

A performance hit

This is all about respecting SQL Server. If we do not use the first key column that makes up the composite key, we are not respecting SQL Server, and it will punish us by performing an index scan and thereby impacting performance:

USE tempdb
GO
--Impact not using the first part of the composite key
SELECT * FROM IndexBehaviourTest WHERE ZoneId = 2;
GO

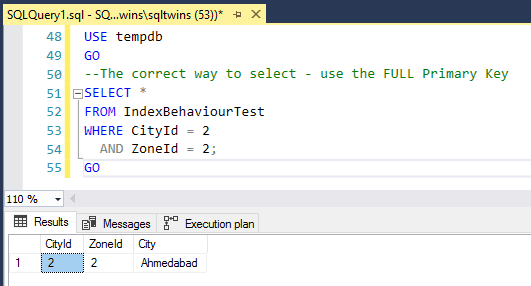
Conclusion – Always use the full primary key

Always remember to treat SQL Server with respect, and never feed it junk to work upon. Always use the full primary key, and you will NEVER run into the specific issues mentioned above.

USE tempdb
GO
--The correct way to select - use the FULL Primary Key
SELECT * 
FROM IndexBehaviourTest 
WHERE CityId = 2 
  AND ZoneId = 2;
GO

Until we meet next time,

Be courteous. Drive responsibly.

SQL Server – TempDB v/s Model database – Minimum size considerations – CREATE DATABASE – Error Msg 1803


A few weeks ago, I wrote a post related to the tempdb where I attempted to answer the question – Is TempDB a copy of the model database? The post attracted a couple of follow-up comments (which I really appreciate, because it gives everyone a great deal to think about) and led me to a thought-filled week-end.

If you have not read my previous post, I strongly recommend that you read it by going to the link here – SQL Server – TempDB – Is it a copy of the Model database?

SCHEMA v/s Storage – Influence of the model database

Most administrators often make changes to their SQL Server database configuration. These changes typically include (and are not limited to):

  • Changing the default sizes and growth values of the data and log files
  • Changing the number of files & file-groups associated to a database
  • Changing the location of their database files
  • Changing the database collation
  • Implement mirroring, log shipping, etc
  • As demonstrated in my previous post, objects can be created in the model database, so that they are available whenever a database is created
    • Because the tempdb is re-created every time the SQL Server restarts, this is applicable to the tempdb also

Most of these changes can be classified into the following major categories:

  • Storage Parameters (size & number of files, collation, etc)
  • Security (changing roles and permissions)
  • Availability & Disaster Recovery (mirroring, log shipping, etc)
  • Schema changes (Defining or manipulating objects)

Each of these changes need to be applied either during database creation or after. These changes therefore need to be persisted somewhere so that they can be picked up during database creation/recovery.

However, the basic schema of any new database within Microsoft SQL Server will always come from the model database, and as demonstrated in my original post this is also applicable to the tempdb. Hence, while any database is schematically a copy of the model database, the storage & other parameters may differ based on the values specified by the user.

Is the initial size of a database independent of the model database?

This question is a tricky one to answer. So, let’s do a simple, 2-part experiment. First, let’s bring our environment up to the state mentioned in my previous post – SQL Server – TempDB – Is it a copy of the Model database?. This can be done by running the following script and restarting the SQL Server instance. Notice that as per the referenced post, tempdb gets copied over from the model database.

/**********************************************
              !!!WARNING!!!
THIS SCRIPT IS PROVIDED AS-IS AND WITHOUT
WARRANTY. THE AUTHOR AND nakulvachhrajani.com (@SQLTwins)
ARE NOT RESPONSIBLE FOR ANY DAMAGE CAUSED 
BY USING THIS SCRIPT.
**********************************************/
USE model
GO
CREATE TABLE DefaultTableTest
( DataId INT IDENTITY(1,1),
  RandomId INT DEFAULT (RAND()*1000),
  DataName VARCHAR(10) DEFAULT 'DEFAULT'
)
GO

/**********************************************
   Insert some test data into the table
**********************************************/
USE model
GO
INSERT INTO DefaultTableTest DEFAULT VALUES
GO 600000

Part 01 – Influence of the model database’s size on the tempdb

Now, remove the test object from both the model and the tempdb databases. Also, let’s use the ALTER DATABASE…MODIFY FILE clause to change the default size of the tempdb.

/**********************************************
              !!!WARNING!!!
THIS SCRIPT IS PROVIDED AS-IS AND WITHOUT
WARRANTY. THE AUTHOR AND nakulvachhrajani.com (@SQLTwins)
ARE NOT RESPONSIBLE FOR ANY DAMAGE CAUSED 
BY USING THIS SCRIPT.
**********************************************/
--Remove the object from the model database
USE model
GO
DROP TABLE DefaultTableTest
GO

--Remove the object from the tempdb database
USE tempdb
GO
DROP TABLE DefaultTableTest
GO

--Alter the tempdb to use an initial size of 10MB as opposed to the current size (approx. 21MB)
ALTER DATABASE tempdb
    MODIFY FILE ( NAME = 'tempdev',
                  SIZE = 10MB
                )
GO

Let’s restart the SQL Server instance, and verify the size of the tempdb.

As you can see, the tempdb continues to be of the same size as the model database. So what went wrong? Well, what’s wrong is that ALTER DATABASE…MODIFY FILE cannot modify the size such that it is smaller than the current size. Per Books On Line (http://msdn.microsoft.com/en-us/library/bb522469.aspx): “If SIZE is specified, the new size must be larger than the current file size.

Now, let’s see if CREATE DATABASE can create a database for us that has an initial size which is less than that of the model database.

Part 02 – Influence of the model database’s size on a newly created database

We will pickup from where Part 01 left off, i.e. the objects in the model database are gone, and both the model and the tempdb are about 21MB each.

Let’s try to create a database by specifying an initial file size which is less than that of the model database:

/**********************************************
              !!!WARNING!!!
THIS SCRIPT IS PROVIDED AS-IS AND WITHOUT
WARRANTY. THE AUTHOR AND nakulvachhrajani.com (@SQLTwins)
ARE NOT RESPONSIBLE FOR ANY DAMAGE CAUSED 
BY USING THIS SCRIPT.
**********************************************/
USE [master]
GO

CREATE DATABASE [InitialFileSizeDefined]
ON PRIMARY (NAME = 'InitialFileSizeDefined_Data', 
            FILENAME = 'C:Program FilesMicrosoft SQL ServerMSSQL11.DENALICTP03MSSQLDATAInitialFileSizeDefined_Data.mdf',
            SIZE = 10MB , MAXSIZE = UNLIMITED, FILEGROWTH = 1MB)
LOG ON (NAME = 'InitialFileSizeDefined_Log', 
        FILENAME = 'C:Program FilesMicrosoft SQL ServerMSSQL11.DENALICTP03MSSQLDATAInitialFileSizeDefined_Log.mdf',
        SIZE = 10MB , MAXSIZE = UNLIMITED, FILEGROWTH = 1MB)
GO

We receive the following error:

Msg 1803, Level 16, State 1, Line 2

The CREATE DATABASE statement failed. The primary file must be at least 21 MB to accommodate a copy of the model database.

Per Books On Line (http://msdn.microsoft.com/en-us/library/ms176061.aspx): “The size specified for the primary file must be at least as large as the primary file of the model database.

Conclusions:

The best part of the day was to summarize my thoughts. We can draw the following conclusions from the above observations:

  1. While every database (including the tempdb) is schematically a copy of the model database, the storage & other parameters may differ
  2. The minimum size of the any database has to be greater than or equal to that of the model database
    • ALTER DATABASE…MODIFY FILE and CREATE DATABASE cannot be used to circumvent this
  3. Extreme caution should be exercised when making changes (schematic or other) that result in a change to the size of the model database

The conclusion #2 is, I believe, by far the most important conclusion of this experiment. I look forward to hearing your thoughts on this topic.

References:

All references today come from Books On Line:

Until we meet next time,

Be courteous. Drive responsibly.

SQL Server – Profiler – Part 6 – Correlating the Profiler Trace with Windows Performance Log Data


Based on popular demand from my colleagues and you, the kind reader, I am currently writing a series of posts on the SQL Server Profiler. Five parts have been published till date, and for your kind reference, here are the links to them:

  1. What is a SQL Trace? Permissions, space requirements and launching the Profiler
  2. Profiler Templates, Template Types & creating custom templates
  3. Trace execution options – Save trace to file or a table, Auto-scroll and keyboard shortcuts
  4. Review T-SQL code to identify objects no longer supported by Microsoft – Deprecation Event
  5. Replaying a trace – from a file or a table – using breakpoints during trace replay

Today, in the last part of the series, we will be looking at another important application of the SQL Server Profiler – Correlating the Profiler Trace with Windows Profiler Log Data. This is helpful when you, as an IT or database administrator suspect that SQL Server is either being held up by or is the cause of an I/O, memory or processor contention.

Windows Reliability & Performance Monitor Log Data

Windows Reliability and Performance Monitor is a Microsoft Management Console (MMC) snap-in that combines the functionality of previous stand-alone tools including Performance Logs and Alerts, Server Performance Advisor, and System Monitor. The tool of interest to us is the Performance Logs and Alerts, erstwhile known as “Perfmon”.

Because this is a post on the SQL Server Profiler, demonstrating the capture of data using the Windows Reliability and Performance Monitor is out of scope. You may refer the References section for more details on the Windows Reliability and Performance Monitor.

For this test, I have created a Performance trace of the following counters (because the goal of this exercise was just to have a demonstration, very basic counters have been chosen. Under “live” circumstances, the counter range would be different):

  • Total Disk – Reads/sec
  • Total Disk – Writes/sec
  • Total Disk – Current Queue Length
  • SQL Server Buffer Manager – Page reads/sec
  • SQL Server Buffer Manager – Page writes/sec

SQL Server Profiler Trace Data

Using the custom trace developed in earlier editions of this series, capture a SQL Server Profiler Log for the following script. Notice that the script has been designed to have a distinct set of read & write activities:

/**********************************************
           !!!! WARNING !!!!
THIS SCRIPT IS PROVIDED AS-IS AND WITHOUT
WARRANTY. THE AUTHOR AND BEYONDRELATIONAL.COM
ARE NOT RESPONSIBLE FOR ANY DAMANGE CAUSED BY
THE USE OF THIS SCRIPT.
**********************************************/
USE tempdb
GO
CREATE TABLE DefaultTableTest
( DataId INT IDENTITY(1,1),
  RandomId INT DEFAULT (RAND()*1000),
  DataName VARCHAR(10) DEFAULT 'DEFAULT'
)
GO

/******************************************
   Insert some test data into the table
- This should generate lots of writes
******************************************/
USE tempdb
GO
INSERT INTO DefaultTableTest DEFAULT VALUES
GO 20000

/******************************************
   Fetch the test data
- This should generate lots of reads!
******************************************/
USE tempdb
GO
SELECT * FROM DefaultTableTest
GO
SELECT * FROM AdventureWorks2008R2.HumanResources.Employee
GO
--Wait for some time
WAITFOR DELAY'00:00:20'
--Regenerate some activity
USE tempdb
GO
SELECT * FROM DefaultTableTest
GO
SELECT * FROM AdventureWorks2008R2.HumanResources.Employee
GO

It is important to remember that the time ranges for the Windows Performance Monitor Log and SQL Server Profiler Trace log must overlap for the Profiler to be able to correlate them.

Correlating the Profiler Trace with Windows Performance Log Data

Once the data has been collected, now is the time to correlate the Profiler trace with the Windows Performance Log data. Below are the steps that you can use to do so:

In the SQL Server Profiler, open the saved Profiler trace file image
On the SQL Server Profiler File menu, click Import Performance Data image
In the Open dialog box, select a file that contains a performance log.

In the Performance Counters Limit dialog box, select the check boxes that correspond to the System Monitor objects and counters that you want to display alongside the trace. Click OK.

image

Notice that the performance monitor graph came out to be exactly as expected

  • Lot of Page writes in the beginning
  • Very small period of disk reads and buffer page reads towards the end
  • Note that disk writes continue in an even fashion throughout – indicating disk writing by the SQL Profiler and the Performance monitor
image

Select an event in the trace events window, or navigate through several adjacent rows in the trace events window by using the arrow keys.

The vertical red bar in the System Monitor data window indicates the performance log data that is correlated with the selected trace event.

image
Click a point of interest in the System Monitor graph.

The corresponding trace row that is nearest in time is selected.

Once the graph receives the mouse click, you can also use the right & left arrow keys to navigate

image
To zoom in on a time range, press and drag the mouse pointer (as if you are selecting a section of an image) in the System Monitor graph image

NOTES:

  1. The time ranges of the Profiler & Windows Performance Log data must overlap
  2. For accurate correlation with System Monitor data, the trace must contain both StartTime and EndTime data columns
  3. Correlation of the Profiler & Windows Performance Log data is not possible for a running trace that is still active & collecting data

References:

I hope you liked reading all 6 parts of my series on the SQL Server Profiler. Do leave your feedback – I really appreciate and thank-you for taking the time out of your busy day to read my posts.

Until we meet next time,

Be courteous. Drive responsibly.

Subscribe to my posts via E-mail: Subscribe here | Read my posts via your favourite RSS reader: Click Here!

SQL Server – Profiler – Part 5 – Replaying a trace – from a file or a table – using breakpoints during trace replay


Based on popular demand from my colleagues and you, the kind reader, I am currently writing a series of posts on the SQL Server Profiler. Four parts have been published till date, and for your kind reference, here are the links to them:

  1. What is a SQL Trace? Permissions, space requirements and launching the Profiler
  2. Profiler Templates, Template Types & creating custom templates
  3. Trace execution options – Save trace to file or a table, Auto-scroll and keyboard shortcuts
  4. Review T-SQL code to identify objects no longer supported by Microsoft – Deprecation Event

Today, we will be looking at another important application of the SQL Server Profiler – Replay. From Books-On-Line:

“Replay is the ability to save a trace and replay it later. This functionality lets you reproduce activity captured in a trace. When you create or edit a trace, you can save the trace to replay it later.

SQL Server Profiler features a multithreaded playback engine that can simulate user connections and SQL Server Authentication. Replay is useful to troubleshoot an application or process problem. When you identify the problem and implement corrections, run the trace that found the potential problem against the corrected application or process. Then, replay the original trace and compare results.”

To demonstrate replay, let’s the following piece of code, which is rigged to fail. (There is no particular reason why I am using a code that is rigged to fail). I used this piece of code in my posts – Exception handling in T-SQL/TRY…CATCH – Underappreciated features of Microsoft SQL Server and Sunset for RAISERROR and sunrise for THROW – SQL 11 (“Denali”).

IF EXISTS (SELECT * FROM sys.objects WHERE name = 'InnerProc' AND type = 'P')
    DROP PROCEDURE InnerProc
GO

CREATE PROCEDURE InnerProc
AS
BEGIN
    BEGIN TRANSACTION ExceptionHandling
       BEGIN TRY
          PRINT 'In the TRY block of the Inner Procedure...'
          SELECT 1/1

          RAISERROR('An error occured in the Inner procedure.',17,1)  --Line #10 considering CREATE PROC...as Line #1

          COMMIT TRANSACTION ExceptionHandling
       END TRY
       BEGIN CATCH
          SELECT ERROR_NUMBER() AS ErrorNumber
                ,ERROR_SEVERITY() AS ErrorSeverity
                ,ERROR_STATE() AS ErrorState
                ,ERROR_PROCEDURE() AS ErrorProcedure
                ,ERROR_LINE() AS ErrorLine
                ,ERROR_MESSAGE() AS ErrorMessage;

          IF @@TRANCOUNT > 0
             ROLLBACK TRANSACTION ExceptionHandling

          PRINT 'Throwing error from the CATCH block of the INNER Procedure...';   
          --Preceding statement MUST be a semi-colon ';'
          THROW
       END CATCH
END
GO

IF EXISTS (SELECT * FROM sys.objects WHERE name = 'OuterProc' AND type = 'P')
    DROP PROCEDURE OuterProc
GO
CREATE PROCEDURE OuterProc
AS
BEGIN
    BEGIN TRY
        PRINT 'In the TRY block of the Outer Procedure...'
        EXEC InnerProc
    END TRY
    BEGIN CATCH
        PRINT 'In the CATCH block of the Outer Procedure...';
        --Preceding statement MUST be a semi-colon ';'
        THROW
    END CATCH
END
GO

--Executing the outer procedure
EXEC OuterProc

Capturing the Replay trace

The SQL Server Profiler ships with a default “TSQL_Replay” trace. For this demo, we will be using this trace type.

image

As demonstrated in the previous posts of the series, capture the trace for the T-SQL script under review.

Replaying the trace

Open the Trace file saved during the trace collection image
Notice the changes to the Profiler toolbar image
In case one needs to stop execution at a certain step/statement, select the statement and hit F9 to set a breakpoint image
Hit F5 or the yellow arrow key to start the Replay.

Apply the required Replay options.

 image image
Once the options are set, click on OK. Notice that the trace replays till the breakpoint is hit.

Alternatively, one can also use the F10 key to step-through the replay trace one step at a time or the (Ctrl + F10) combination to run to a selected cursor position.

image

Notice that during the replay options configuration, you can choose whether or not to have the SQL Server blocked process monitor running. This is especially useful if you are trying to replay a trace that you suspect is involved in heavy locking/blocking on your server.

Also notice the status bar, which now shows the number of open connections and the percentage of trace that has finished the replay.

In my next post…

The next post will be the final one of the series, in which I will discuss how to correlate performance counters with the Profiler data.

If you have suggestions on any applications of the Profiler that you want me to cover, drop me a note, and I will try to cover them in future posts.

References

Until we meet next time,

Be courteous. Drive responsibly.

Subscribe to my posts via E-mail: Subscribe here | Read my posts via your favourite RSS reader: Click Here!

SQL Server – Profiler – Part 4 – Review T-SQL code to identify objects no longer supported by Microsoft – Deprecation Event


Based on popular demand from my colleagues and you, the kind reader, I am currently writing a series of posts on the SQL Server Profiler. Three parts have been published till date, and for your kind reference, here are the links to them:

  1. What is a SQL Trace? Permissions, space requirements and launching the Profiler
  2. Profiler Templates, Template Types & creating custom templates
  3. Trace execution options – Save trace to file or a table, Auto-scroll and keyboard shortcuts

Today, we will be looking at one of the events that I came across when we were certifying our product against Microsoft SQL Server 2008 when it was originally released. You may want to do the same when certifying your application against SQL 2012 (code named: “Denali”), currently in CTP03. We will see how the Profiler can help us in identifying T-SQL code that would no longer be supported going forward.

Deprecation Announcement Event Class

This Event class can be used to capture events that occur when a feature scheduled to be deprecated in some future release of Microsoft SQL Server is encountered. These features will still be available in the next major release of SQL Server, but may not be available in future releases.

If such code is encountered, it is recommended to consider replacement with suggested replacements.

Deprecation Final Support Event Class

This Event class can be used to capture events that occur when a feature scheduled to be deprecated in the next release of Microsoft SQL Server is encountered. If any such code is encountered, it is definitely time to refactor the code to use the recommended replacements.

An example

Let us intentionally create a scenario that would trigger one of the Deprecation Event classes.

Create a New Profiler Trace image
Select the “Deprecation” events from the Event Selection screen image
Execute the following T-SQL code against the instance of Microsoft SQL Server being monitored
/*
** Per Books On Line (http://msdn.microsoft.com/en-us/library/ms143729(SQL.110).aspx),
** SET ROWCOUNT for INSERT, UPDATE and DELETE will no longer be supported in the next
** Microsoft SQL Server release.
** Therefore, we expect this to be captured in the Deprecation Final Support Event Class
*/

USE AdventureWorks2008R2
GO

BEGIN TRANSACTION BRDemo
    SET ROWCOUNT 10
    UPDATE HumanResources.Employee SET VacationHours += 1
ROLLBACK TRANSACTION BRDemo
Notice the data captured by the Profiler image

In my next post…

Essentially, two major applications of the SQL Server Profiler remain:

  1. Correlating Performance data
  2. Replaying a trace

We will be discussing these in the next 2 posts, which will be the final ones in the series. If you have suggestions on any applications of the Profiler that you want me to cover, drop me a note, and I will try to cover them in future posts.

References:

Until we meet next time,

Be courteous. Drive responsibly.

Subscribe to my posts via E-mail: Subscribe here | Read my posts via your favourite RSS reader: Click Here!